Article Text

Abstract
First described in 1991 and introduced into clinical practice in 1996, optical coherence tomography (OCT) now has a very extensive role in many different areas of ophthalmological practice. It is non-invasive, cheap, highly reproducible, widely available and easy to perform. OCT also has a role in managing patients with neurological disorders, particularly idiopathic intracranial hypertension. This review provides an overview of the technology underlying OCT and the information it can provide that is relevant to the practising neurologist. Particular conditions discussed include papilloedema, optic disc drusen, multiple sclerosis and neuromyelitis optica, other optic neuropathies, compression of the anterior visual pathway and various neurodegenerative conditions.
- benign intracranial hypertension
- neuroophthalmology
- ophthalmology
- vision
Statistics from Altmetric.com
Introduction
Optical coherence tomography (OCT) provides exquisite, high-resolution anatomical detail of the retina and optic disc. It is non-invasive, cheap, highly reproducible, widely available and easy to perform. First described in 1991,1 it was introduced as a clinical tool in 1996 and was rapidly taken up by ophthalmologists, becoming established in routine ophthalmic practice by 2005. Several technical enhancements have subsequently been introduced that have greatly enhanced its resolution and the sort of information it can provide. In ophthalmological practice, OCT plays a major role in the management of patients with glaucoma, age-related macular degeneration and other retinal diseases, but it has other applications such as in imaging the anterior segment and in following up patients on potentially retinotoxic medications such as hydroxychloroquine. It also has a role in managing patients with many neurological disorders.2 3 This review aims to familiarise neurologists with OCT and its current place in the diagnosis, monitoring and prognostication of these conditions.
Technical aspects
The underlying principle of OCT is reminiscent of diagnostic ultrasound scanning. Instead of sound energy, low-coherence near-infrared light is shone onto the retina. Different retinal layers reflect light of specific intensity and timing, depending on their individual optical properties. OCT deconvolutes the resulting collection of light returning from the retina to generate high-resolution, cross-sectional images, which can be segmented into different layers with ‘near-histological’ resolution.1 Adjacent linear scans (A-scans) are assembled to generate two-dimensional, or cross-sectional, images (B-scans) (figure 1) and adjacent B-scans can then be assembled to create three-dimensional, volumetric images. These are referred to as ‘cubes’.

Comparison of retinal histology and OCT output: (A) retinal histology, (B) OCT output. ELM, external limiting membrane; GCL, ganglion cell layer; ILM/NFL, internal limiting membrane/nerve fibre layer; INL, inner nuclear layer; IPL, inner plexiform layer; IS PR, inner segments of photoreceptors; OCT, optical coherence tomography; ONL, outer nuclear layer; OPL, outer plexiform layer of Henle; OS PR, outer segments of photoreceptors; RPE/choriocapillaris, retinal pigment epithelium and choriocapillaris complex. Reproduced from Arevalo et al 42 with permission from Dove Medical Press.
The original time-domain OCT had a depth resolution of about 10 µm and could generate 400 A-scans/s. Subsequent modifications of the light source and analysis programs have resulted in spectral-domain OCT and swept-source OCT. These have improved depth resolution to 5 µm and increased acquisition speed enormously, permitting up to 400 000 A-scans/s,4–6 resulting in better image quality, better tissue penetration (with improved imaging of the choroid and lamina cribrosa), shorter scanning time and reduced movement artefact. Table 1 provides details of the different technologies. It is possible to detect movement occurring within the retina during scanning and this phenomenon has been harnessed to produce maps of blood flow (OCT angiography). OCT angiography provides qualitative images of perfused blood vessels and also allows calculation of the vascular density in the different retinal layers. Of note, though, arteries and veins cannot be distinguished, and shadowing of inferior vessels by superior vessels can lead to incomplete imaging.6 The most recent innovation involves the use of adaptive optics, that is, a deformable mirror that corrects for ocular aberrations in real time, generating unprecedented resolution; this is currently still a research tool.6
OCT scanners and protocols (reproduced from Bhende et al 4)
Interpreting OCT
The information relevant to neurological practice is principally derived from imaging the optic disc and/or the macula (figure 2). Different devices generate slightly different printouts, but the overall content is similar, following the established Advised Protocol for OCT Study Terminology and Elements guidelines.7 Scans of the optic disc investigate the thickness of the peripapillary retinal nerve fibre layer (RNFL). This is most commonly assessed from a ‘circle scan’, which involves placing a circle of 3.4 mm diameter around the optic disc. OCT information about RNFL thickness is provided graphically by following the circle’s circumference, starting temporally and running through superior, nasal and inferior quadrants before returning to the starting point. RNFL thickness is not uniform: the nerve fibres entering the optic disc from the retina are concentrated in the superior and inferior arcuate bundles, which are therefore thicker. The OCT printout compares RNFL thickness at each point to the population norm: red, yellow, and green bands reflect the 1%, 5% and 95% population cut-offs, respectively. Quantitative information is usually provided for the whole RNFL in a summary table, and further information about each of the quadrants is provided in separate diagrams (figure 2).

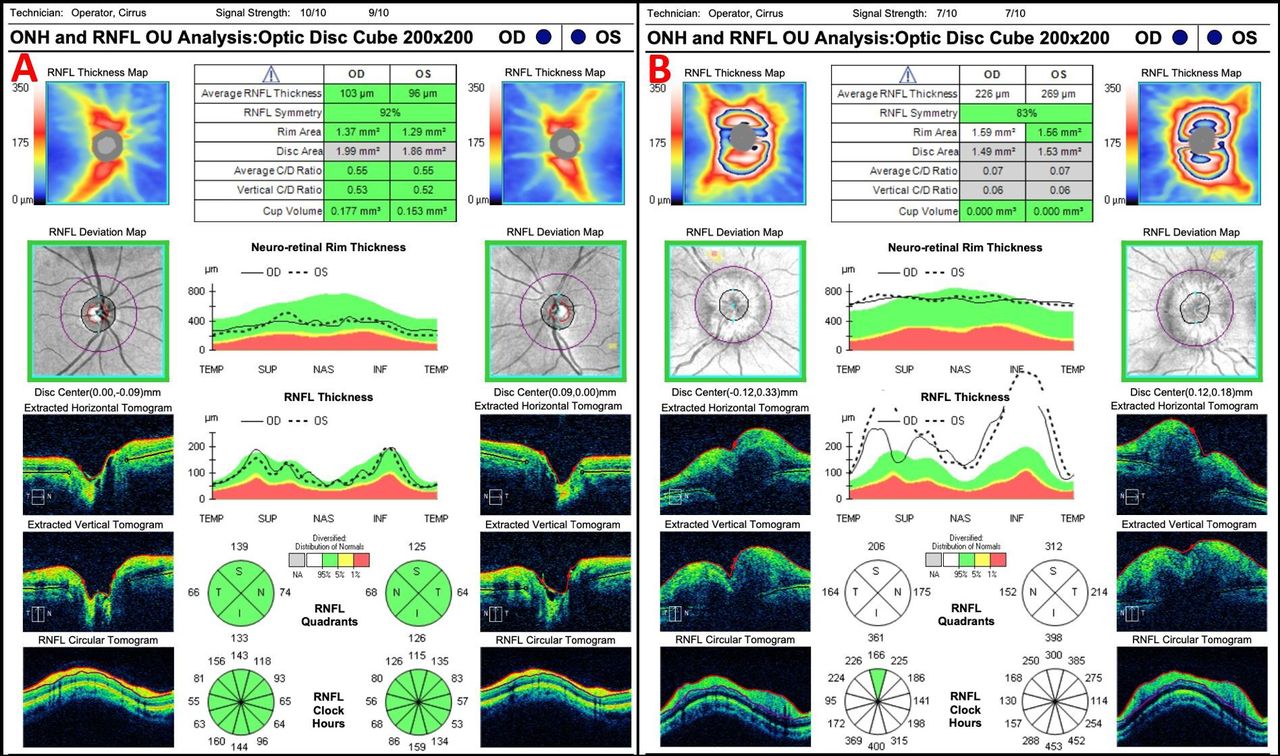
OCT optic disc cube print out. (A) Normal optic disc (all measures are indicated in green). (B) Papilloedema showing elevated average RNFL thickness (indicated by white colour). OCT, optical coherence tomography; OD, oculus dexter/right eye; ONH, optic nerve head; OS, oculus sinister/left eye; OU, oculi uterque/both eyes; RNFL, retinal nerve fibre layer.
Macular ‘cubes’ typically cover an area of retinal surface of about 9×12 mm. The depth of the entire retina from internal limiting membrane to retinal pigment epithelium varies from 250 to 300 µm. OCT provides detailed information about the depth of the various retinal layers but it is important to remember that the OCT layers are derived from physical properties, not from true histology. As a result, it may be difficult to distinguish histologically discrete layers clearly. Depending on the OCT machine and analysis program being used, depth information about a particular layer of interest may be presented in slightly different ways, for example: the ganglion cell layer (GCL), the inner plexiform layer (IPL), a composite of the two (GCIPL) or the ganglion cell complex (comprising macular RNFL, GCL and IPL). For simplicity, this article will use ‘GCIPL’ to refer to any of these possible measurements. Unless otherwise specified, ‘RNFL’ will refer to the optic disc.
The GCIPL is particularly relevant to neurological disease as it can demonstrate atrophy and ganglion cell loss. Of course, OCT can also examine deeper layers as well. Like the optic disc, the macular region is not uniform and different sectors are variably affected by disease processes. Accordingly, quantitative information is usually provided for the entire macula as well as providing sector-by-sector information. The pattern of sector segmentation is arbitrary: standard output may divide the macula into four or six radial sectors but there are many possible segmentation strategies based on, for example, the Early Treatment Diabetic Retinopathy Study, hemisphere partition, the Zeiss elliptical partition or even ‘self-defined’ regions of interest.8 In terms of depth, it is currently possible to segment images into up to 11 different retinal layers, but obtaining this level of segmentation requires detailed knowledge of how to manipulate commercial scanner output9 and is not generally relevant to day-to-day practice.
RNFL thickness at the disc varies with age. It is at its thickest (110–120 µm) at about age 15 years, and then declines by about 0.37 µm/year to approximately 90 µm in those aged 70 years old.2 Similarly, GCIPL thickness declines by about 0.57 µm/year.10 Some other layers of the retina (eg, the outer plexiform layer, outer photoreceptor segments and photoreceptor complex) become somewhat thicker with age.8
Like all clinical measurement tools, OCT is subject to artefacts: these may arise from variations in signal strength, pupil size, globe size (for example, high myopia), or optic disc area, from opacities in the optic media, or from movement.2 In addition, there may be operator-related artefacts related to poor alignment or focus, and the machine algorithms may fail to segment the various retinal layers correctly. As above, different devices use slightly different segmentation algorithms and thus generate slightly different values, meaning that it is important to use the same device when following patients up over time.3
Role in management of patients with neurological conditions
In addition to its role in diagnosis and long-term monitoring of glaucoma, OCT also has the potential to assist in distinguishing between glaucomatous optic neuropathy and other non-glaucomatous optic neuropathies as the patterns of thinning differ: glaucoma typically affects the superior and inferior poles of the optic disc and deviation from this suggests alternative pathology. Similarly, the most discriminatory region of the macula for glaucoma appears to be the inferior temporal sector.8 In neurological practice, OCT has a major role in managing the various different causes of optic disc swelling, but it can also contribute to the management of many other conditions, including inflammatory, vascular, compressive, inherited and degenerative optic neuropathies.
Papilloedema and idiopathic intracranial hypertension
Before OCT was introduced, papilloedema was graded clinically according to the Frisén scale. While interindividual variability of clinical assessment was reasonable, OCT has revolutionised the management of disc swelling by providing a precise measurement that can be used for diagnosis and follow-up over time.11 There are some technical considerations in that OCT may fail to detect an increase in RNFL in very mild papilloedema and its accuracy may be compromised in severe papilloedema because of increased scatter and absorption.6 11 Importantly, this can result in errors in the automated process which generates the measurement of RNFL, particularly in moderate to severe papilloedema. This so-called ‘segmentation error’ can be up to 11%, meaning that it is important to look at the scan itself and, if necessary, correct the automatically generated numbers manually.12
OCT is therefore ideally placed to monitor patients with idiopathic intracranial hypertension over time (figure 3),13 as well as to manage the recently described spaceflight-associated neuro-ocular syndrome.14 In addition to measuring RNFL thickness, OCT provides information about changes in the retinal pigment epithelium and Bruch’s membrane (figure 4).15 Under normal circumstances, Bruch’s membrane at the optic disc forms a V-shape, pointing away from the vitreous into the optic nerve. In papilloedema, the membrane inverts to form a U-shape pointing away from the nerve, probably as a direct result of the changes in relative pressures across the lamina cribrosa. Changes in Bruch’s membrane can help to distinguish optic disc swelling due to raised intracranial pressure from other causes of disc swelling (for example, anterior ischaemic optic neuropathy), but there is not a tight correlation between the shape and cerebrospinal fluid pressure or with degree of papilloedema,15 so this is not always that helpful clinically.

Raster scans though the optic disc. (A) Normal optic disc, showing downward deflection of Bruch’s membrane opening (white arrow). (B) Papilloedema, showing upward deflection of Bruch’s membrane opening (white arrow).

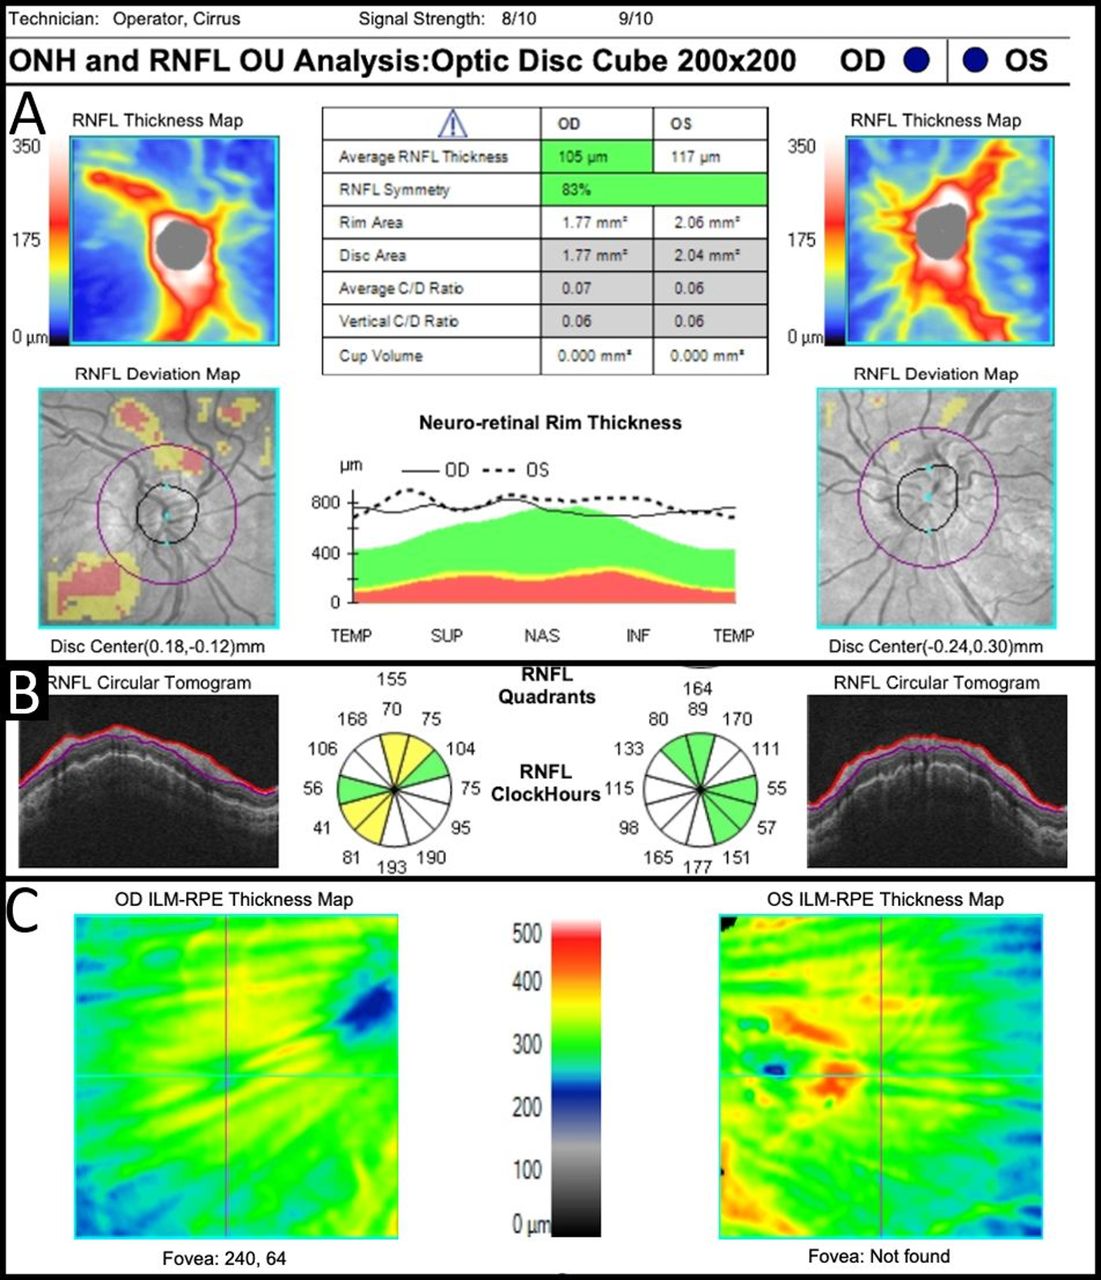
Choroidal folds with associated disc oedema. (A) Elevated neuroretinal rim. (B) Wrinkled appearance to Bruch’s membrane on radial raster scan. (C) Macular cube analysis thickness map showing radial folds. ILM/RPE, internal limiting membrane/retinal pigment epithelium; OD, oculus dexter/right eye; ONH, optic nerve head; OS, oculus sinister/left eye; OU, oculi uterque/both eyes; RNFL, retinal nerve fibre layer.
In addition to helping to distinguish papilloedema from pseudopapilloedema (see below), OCT can detect other changes which occur in papilloedema such as Patton’s (retinal) lines and choroidal folds (figure 4). These are seen in many patients with papilloedema but their role in diagnosis and management of idiopathic intracranial hypertension is still uncertain.16 It has recently been suggested that OCT might serve a non-invasive method of managing intracranial pressure in intracranial hypertension17—while the correlation between OCT and intracranial pressure measurements is promising, further work is still needed before this can be used in clinical practice.
Disc swelling in intracranial hypertension improves with treatment and this is reflected in a reduction of RNFL thickness on OCT. Reduction in RNFL thickness may reflect a reduction in oedema but it may also result from the development of optic atrophy. Thinning of the GCIPL complex at the macula is an early indicator of atrophy in intracranial hypertension, often detectable while papilloedema persists, and thinning of the GCIPL suggests a poor visual outcome. Examination of the macular region on OCT also allows detection of other causes of visual loss such as subretinal fluid which may need addressing independently (figure 5).6
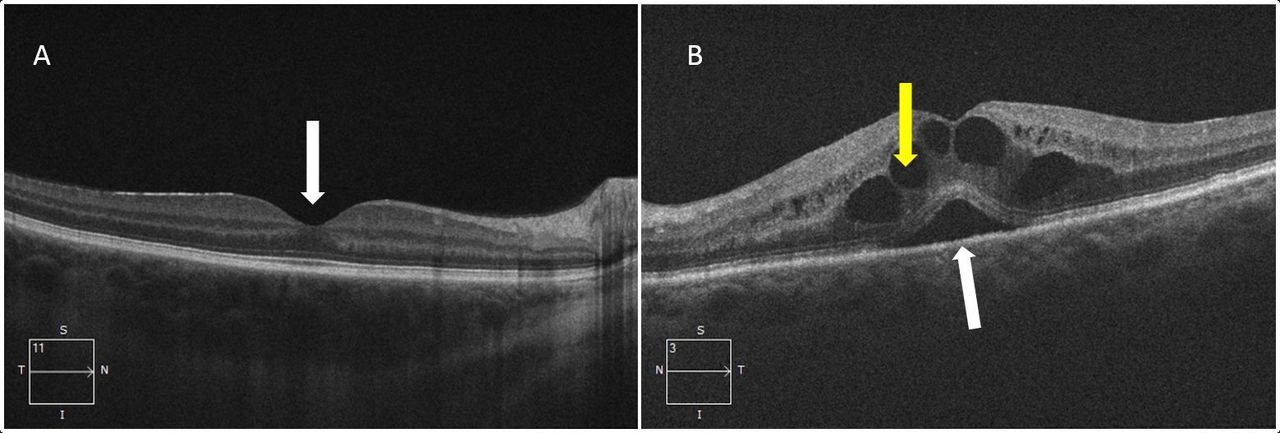
Macular raster images. (A) Normal macular architecture with foveal pit (white arrow). (B) Cystoid macular oedema showing subretinal fluid (white arrow) and intraretinal cystic spaces (yellow arrow).
A recent study using OCT to measure spontaneous venous pulsation at the optic disc in patients with intracranial hypertension found a significant association between increased intracranial pressure and reduction in venous pulsation.18 Similarly, OCT angiography shows dilation/tortuosity of large vessels and tangling/curling of capillaries in intracranial hypertension.6 These abnormalities differ significantly from the capillary dropout which is seen in ischaemic optic neuropathy (see below). Neither of these results is useful clinically at this point, but a non-invasive measure of cerebrospinal fluid opening pressure would be very welcome.
Optic disc drusen
OCT has a role in detecting and managing anatomical variants such as optic nerve hypoplasia and myelinated nerve fibres.3 More important in neurological practice, it is extremely helpful in differentiating disc swelling due to papilloedema from that due to optic disc drusen. Indeed, enhanced depth imaging OCT now forms part of the formal assessment and diagnosis of drusen.19 The appearance and main diagnostic features of optic disc drusen on OCT are shown in figure 6. Importantly, the drusen must be distinguished from mimics such as retinal blood vessels and ‘peripapillary hyper-reflective ovoid mass-like structures’ whose significance is, as yet, uncertain.20

Optic disc drusen. (A,B) Autofluorescence images of optic discs showing very mild and very obvious optic disc drusen, respectively. (C) Raster image of a large optic disc druse with a hyporeflective core (asterisk), hyper-reflective margin (white arrow) and small conglomerates of other drusen (yellow arrow).
Multiple sclerosis
There are multiple roles for OCT in the management of patients with multiple sclerosis. At a general level, OCT may be helpful in determining whether the cause of a central scotoma is due to optic neuritis or to a problem at the macula such as cystoid macular oedema (figure 5). Readers will be familiar with its specific role in detecting cystoid macular oedema in patients treated with fingolimod.21 Interestingly, some patients may develop increased macular thickness while on treatment with fingolimod.22
In the acute stages of optic neuritis, OCT may demonstrate increased RNFL thickness if there is disc swelling. Following recovery, there is often optic atrophy, which is reflected in thinning of the RNFL. While RNFL thinning is not always associated with clinical impairment of vision, thinning to less than 75–80 µm is usually associated with significant clinical visual impairment.23 Thinning can also be seen in the GCIPL at the macula where evidence of atrophy can often be seen within weeks of the onset of optic neuritis, significantly before it become obvious at the optic disc where underlying atrophy can be masked by persistent swelling.2 Overall, loss of RNFL and GCIPL thickness correlates well with clinical and paraclinical parameters of visual function, disability and MRI in optic neuritis.24
Eyes that have previously been affected by optic neuritis show, on average, 33%–46% thinning of the RNFL along with a loss of macular volume averaging about 11%. Because optic neuritis is usually unilateral, interocular asymmetry of RNFL thinning is helpful in distinguishing patients from healthy controls.25 Interestingly, though, unaffected fellow eyes can show RNFL thinning of up to 27%.26 The mechanism is not clear but the RNFL thinning in eyes unaffected by optic neuritis is proportionately greater in patients with secondary progressive multiple sclerosis than in those with relapsing–remitting multiple sclerosis, suggesting that it may reflect underlying degeneration.27 Consistent with the idea that inflammation and degeneration are distinct, thinning of a focal area of the macula (the M zone) has been detected in eyes without a history of optic neuritis in patients with relapsing–remitting multiple sclerosis, differing somewhat from the area that is affected in optic neuritis (the U zone).8 Of interest, OCT angiography suggests that blood vessel density in the retina correlates inversely with the Expanded Disability Status Scale (EDSS), though this observation is not yet clinically useful.24
Many studies have shown a correlation between GCIPL and RNFL thickness and visual acuity (particularly low-contrast acuity), as well as dyschromatopsia. Unlike OCT angiography, correlation with disability measured by the EDSS is not a consistent finding. However, there is a correlation between RNFL thinning and both lesion load and brain atrophy on MRI, and an inverse correlation with delayed visual evoked responses. RNFL thinning is also associated with an increased risk of disease progression.24 These observations have led to the proposal that OCT might represent an alternative to MR scanning for monitoring disease progression,28 but this will require further work before it can be introduced into clinical practice.
Several studies have suggested a difference between the changes on OCT in multiple sclerosis and in neuromyelitis optica spectrum disorder. For example, neuromyelitis optica spectrum disorder typically results in more severe thinning of both RNFL and GCIPL as well as more frequent microcystic macular oedema.24 29 In addition, it appears to be less likely to cause the subclinical RNFL thinning which occurs in the absence of optic neuritis in multiple sclerosis.30 However, these differences are not sufficiently marked to allow OCT to distinguish the two conditions in a clinical setting.2
Other optic neuropathies
OCT can detect disc swelling associated with anterior ischaemic optic neuropathy. The swelling usually settles over 6 months, leaving behind significant RNFL and GCIPL thinning. As in optic neuritis, GCIPL thinning can often be detected before RNFL thinning, and this is associated with a poorer visual outcome. OCT also has a role in detecting the small/absent optic cup (disc-at-risk) in the as-yet unaffected fellow eye.31
Inherited and metabolic optic neuropathies have a predilection for the papillomacular nerve fibre bundle which supplies central vision. This is reflected in marked thinning of the temporal sector of the RNFL on OCT in these conditions, corresponding to the temporal pallor observed on funduscopy. Similarly, thinning of the GCIPL implies ganglion cell loss and is associated with a poor outcome. As with other conditions, thinning of the GCIPL often develops before thinning is obvious at the disc.32
Toxicity (eg, due to ethambutol, methanol, amiodarone or linezolid) and metabolic deficiency (eg, B12, thiamine, folate or copper) are associated with thinning of the RNFL, particularly temporally, and the same applies to hereditary disorders such as Wolfram’s syndrome, Behr’s syndrome, Friedreich’s ataxia, the spinocerebellar ataxias (specifically types 1 and 3), and mitochondrial disorders such as mitochondrial encephalopathy with lactic acid and stroke-like episodes and chronic progressive external ophthalmoplegia.32 OCT is particularly useful in the management of Leber’s hereditary optic neuropathy: asymptomatic carriers have statistically significant thickening of the RNFL, and thinning of the GCIPL can be detected in the days leading up to symptom onset. At symptom onset, there is thickening of superior and inferior portions of the RNFL, followed by normalisation, and then thinning, of temporal RNFL as the acute phase settles.32
The entire RNFL is typically thinned in autosomal dominant optic atrophy, typically associated with thinning of the GCIPL. Preservation of the outer layers of the retina helps to distinguish autosomal dominant optic atrophy from retinal dystrophies in children.28 Conversely, there is marked thickening of the RNFL in autosomal recessive spastic ataxia of Charlevoix–Saguenay—a cut-off of 119 µm yields a sensitivity of 100% and specificity of 99% in this condition.33
In addition to its role in distinguishing glaucoma from other optic neuropathies, OCT provides information about the outer portions of the macula, allowing differentiation between diseases which are predominantly retinal (for example, disorders of photoreceptors) from those which are due to diseases of the optic nerve.
Compression of the anterior visual pathway
Damage to optic nerve fibres anterior to the lateral geniculate nucleus is associated with retrograde degeneration which can be detected as thinning of the GCIPL at the macula before it is detectable at the optic disc. This can develop in optic nerve compression from meningiomas, other neoplasms, inflammatory disorders or enlarged muscles in thyroid eye disease.5 Though there may be thinning of the RNFL in chronic optic nerve compression, there may also be swelling at the optic disc if the anterior portion of the optic nerve is involved. This may mask loss of nerve fibres. Thinning of the GCIPL is a better guide to prognosis: in non-glaucomatous optic neuropathies, prognosis is very poor if RNFL thickness is less than 45 µm.34
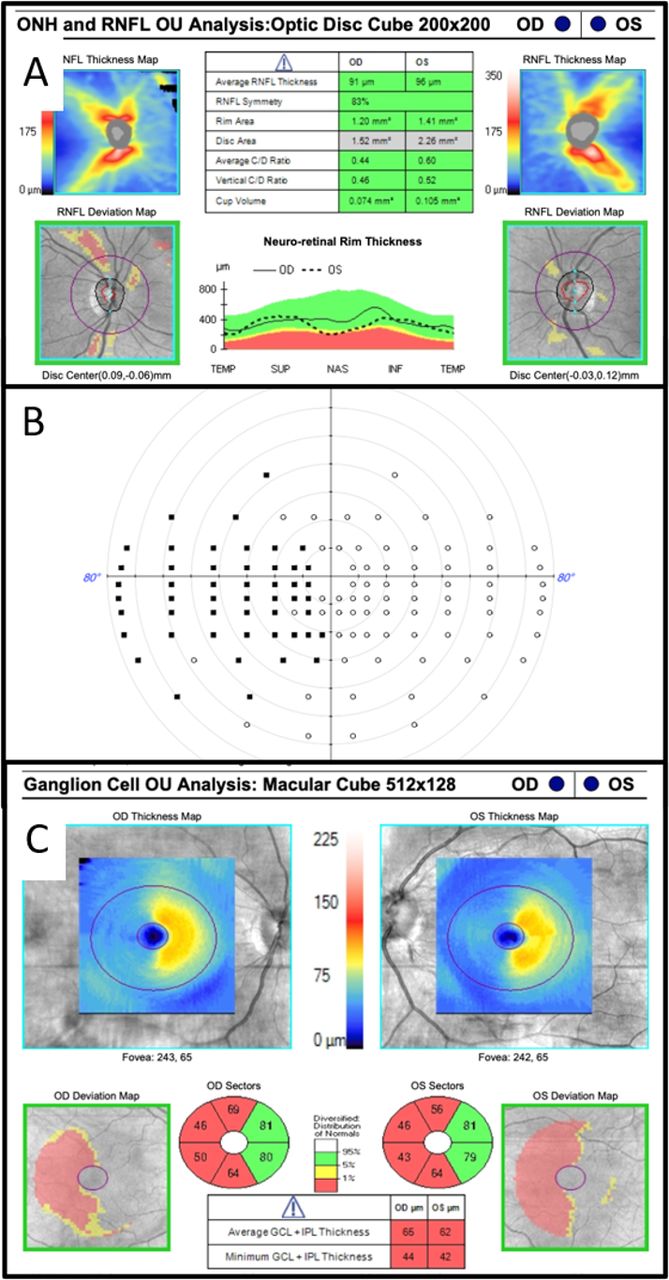
Band atrophy of the optic disc is a well-recognised clinical sign of chiasmal compression but it may be hard to detect on ophthalmoscopy. Many studies have shown predominant loss of nasal and temporal quadrants of the RNFL at the disc on OCT, and similar topographic abnormalities are also seen on OCT angiography.5 OCT is particularly useful for prognostication in relation to compression of the optic chiasm by pituitary tumours: patients with objectively measurable RNFL thinning on OCT are significantly less likely to recover after surgery, the cut-off being about 70 µm.35 36 There may also be thinning of the GCIPL, often in a pattern reflecting the bitemporal hemianopia (figure 7). In addition, microcystic changes may be seen in the deeper layers of the macula, but these are relatively non-specific as they are also seen in patients with glaucoma, multiple sclerosis, neuromyelitis optica spectrum disorder and inherited neuropathies, presumably reflecting the severity of retinal ganglion cell loss.5
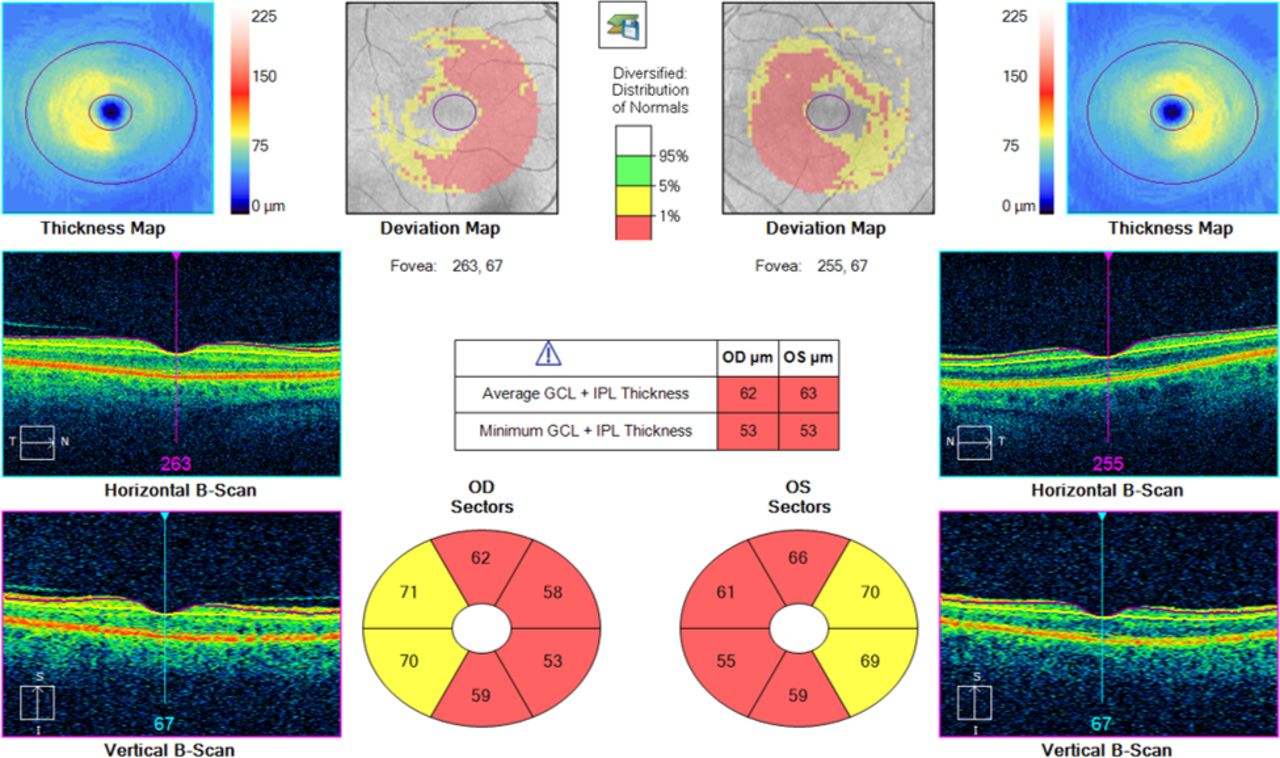
Macular retinal ganglion cell analysis in a case of bitemporal hemianopia secondary to pituitary compression demonstrating thinning of ganglion cells nasal to the macula in both eyes. GCL, ganglion cell layer; IPL, inner plexiform layer; OD, oculus dexter/right eye; OS, oculus sinister/left eye.
Other neurological diseases
Atrophy of the GCIPL can be seen following stroke, with ‘homonymous’ abnormalities at the macula which clearly parallel the homonymous visual field loss in the two eyes (figure 8).37 This provides strong evidence for transsynaptic retrograde axonal degeneration.

OCT from a patient 12 months after surgical excision of right occipital meningioma. (A) Normal optic disc appearance. (B) Estermann binocular visual field showing a left homonymous hemianopia. (C) Macular retinal ganglion cell analysis demonstrating thinning of ganglion cells to right of macula in both eyes. GCL, ganglion cell layer; IPL, inner plexiform layer; OCT, optical coherence tomography; OD, oculus dexter/right eye; ONH, optic nerve head; OS, oculus sinister/left eye; OU, oculi uterque/both eyes; RNFL, retinal nerve fibre layer.
Patients with Alzheimer’s disease also demonstrate significant reduction in RNFL and GCIPL thickness compared with controls; and in patients with minimal cognitive impairment, RNFL thinning is associated with a greater risk of progressing to dementia.8 Other causes of dementia (for example, dementia with Lewy bodies and dementia associated with Parkinson’s disease) are also associated with thinning of the RNFL, but there is no significant difference between these diseases and Alzheimer’s dementia.38
Granted that dopamine is present as a neurotransmitter in the retina (eg, in dopaminergic amacrine cells),39 it is perhaps not surprising that there is thinning of the RNFL, macula and inner retina on OCT in Parkinson’s disease.40 41 The inferior sector of the GCIPL seems to be most consistently affected8; OCT might be a useful biomarker in trying to distinguish the different subtypes of Parkinson’s disease.2 An interesting suggestion that levodopa might be neuroprotective has been proposed based on the observation that the RNFL is significantly thicker in patients treated with levodopa than in those not treated with it. This remains speculative, and it is noteworthy that there is not a tight correlation between RNFL and GCIPL thickness and the clinical scales used to assess Parkinson’s disease.39
Conclusion
As has been frequently observed, the eye is the window to the brain and OCT exemplifies this par excellence. Granted the ease with which information can be obtained and the ever-increasing levels of anatomical detail, OCT is the subject of much ongoing research into neurological disorders. Ultimately, it may prove to have a role in the management of many different conditions. For example, it may prove useful as a biomarker in neurodegenerative conditions or, alternatively, it may serve as a surrogate marker of intracerebral pressure in idiopathic intracranial hypertension or of disease severity in multiple sclerosis. At a more fundamental level, it can provide useful information about underlying disease processes, for example, transsynaptic retrograde degeneration.
At this point, the major role of OCT in neurological practice is in the management of papilloedema, particularly in the context of idiopathic intracranial hypertension. In addition, it has a clear role in detecting optic disc drusen and in providing information about the cause of visual loss where this is in doubt. It has a well-established place in monitoring patients on certain treatments such as fingolimod and can provide useful information about prognosis in many different causes of optic neuropathy. With time, its role in neurological practice is likely to expand.
Key points
Optical coherence tomography (OCT) is non-invasive, cheap, highly reproducible, widely available and easy to perform.
OCT is extremely helpful in the diagnosis and follow-up of patients with papilloedema, particularly in the context of idiopathic intracranial hypertension.
OCT is helpful in the management of optic neuritis and in monitoring patients taking fingolimod.
It is important to use the same device when following patients up over time.
Ongoing research is investigating the possibility that OCT might serve as a useful clinical biomarker in neurodegenerative disorders and, possibly, as a surrogate marker of intracerebral pressure.
Further reading
Nolan RD, Narayana K, Galetta SL, et al. Optical coherence tomography for the neurologist. Semin Neurol 2015;35:564–7
de Carvalho ER, Maloca PM. Overview of optical coherence tomography in neuro-ophthalmology. Ann Eye Sci 2020;5:14 http://dx.doi.org/10.21037/aes.2019.12.08
Arevalo JF, Lasave AF, Arias JD, et al. Clinical applications of optical coherence tomography in the posterior pole: the 2011 José Manuel Espino Lecture – Part 1. Clin Ophthalmol 2013;7:2165–9
Ethics statements
References
Footnotes
Contributors Both authors contributed equally to the design, writing and editing of this article.
Funding The authors have not declared a specific grant for this research from any funding agency in the public, commercial or not-for-profit sectors.
Competing interests None declared.
Provenance and peer review Commissioned. Externally peer reviewed by Susan Mollan, Birmingham, UK and Mark Lawden, Leicester, UK.
Linked Articles
- Editors’ commentary
Other content recommended for you
- Progressive retinal nerve fibre layer thinning and choroidal microvasculature dropout at the location of disc haemorrhage in glaucoma
- The effect of head tilt on the measurements of retinal nerve fibre layer and macular thickness by spectral-domain optical coherence tomography
- Peripapillary retinal nerve fibre layer thinning, perfusion changes and optic neuropathy in carriers of Leber hereditary optic neuropathy-associated mitochondrial variants
- The Humphrey optical coherence tomography scanner: quantitative analysis and reproducibility study of the normal human retinal nerve fibre layer
- Is the peripapillary retinal perfusion related to myopia in healthy eyes? A prospective comparative study
- Retinal imaging in Alzheimer’s disease
- Bruch's membrane opening changes and lamina cribrosa displacement in non-arteritic anterior ischaemic optic neuropathy
- Detection of mild papilloedema using spectral domain optical coherence tomography
- Comparing the ganglion cell complex and retinal nerve fibre layer measurements by Fourier domain OCT to detect glaucoma in high myopia
- Association of foveal avascular zone area withstructural and functional progression in glaucoma patients